There have been many articles recently talking about overall streams being down in the recording industy because of the current Covid 19 Pandemic. This article in Verity suggests the 7.6% drop is caused by a mix of people not listening while commuting and increased engagement with TV and News and I’d also suggest because Cafes and offices aren’t open with their streaming playlists. It will be interesting to see what increase in stream payment rates this reduction in streaming numbers has given the way the payments are calculated.
This was originally posted on the 6th April and was updated on 27th April with new info. The update is at the end of the post.
Looking at my graphs on Spotify for Artists I got the sense that my streams and listeners were increasing (my followers definitly were!) but the Artists platform doesn’t allow for any kind of analysis. So I downloaded the numbers and came up with these two graphs, confirming that my streams on Spotify are up!
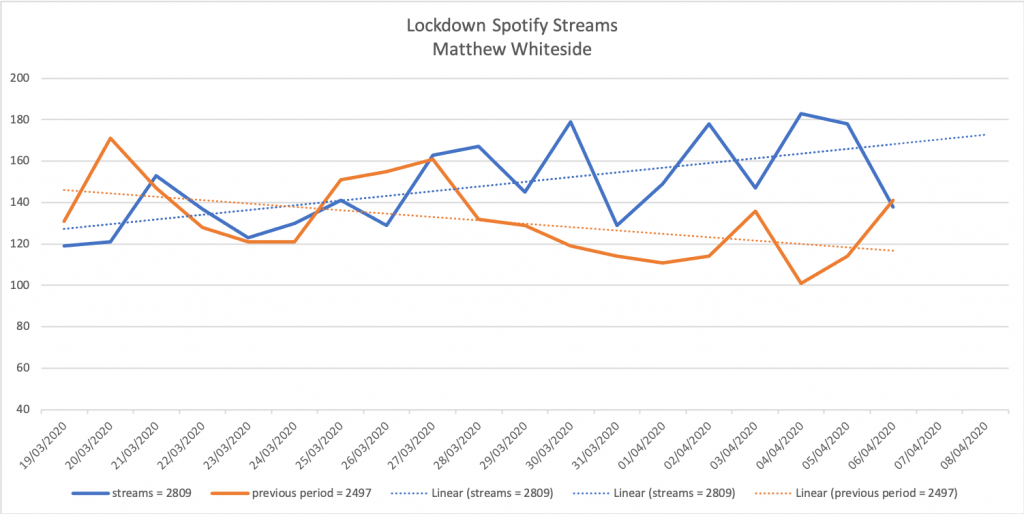
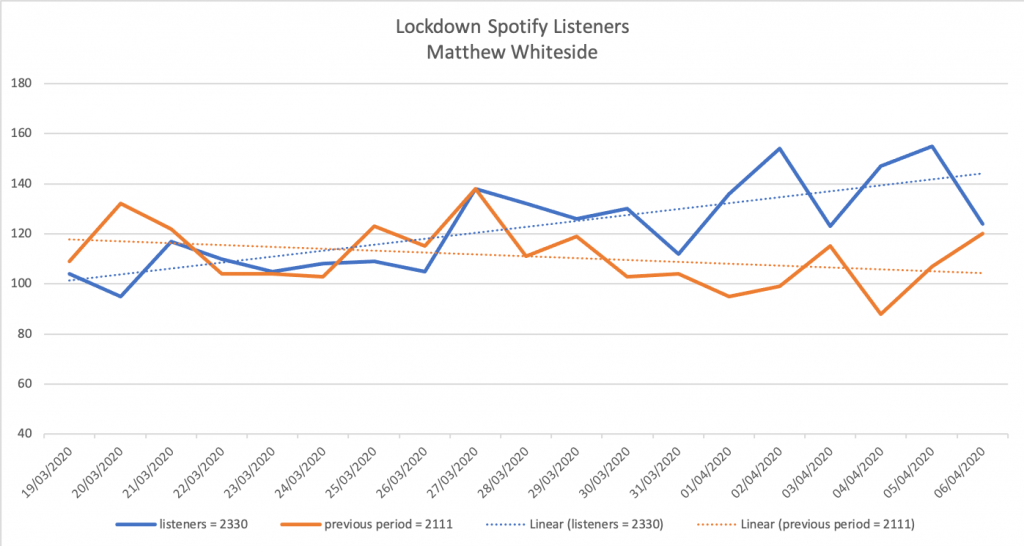
The two graphs show streams and listeners for the last three weeks compared to the previous three weeks. I’m not a data analysist but to me these graphs, even just at a glance before adding the trend lines, confirmed my suspicions that my streams are up in this period while the music industry is down overall.
In the last three weeks I’ve had 2809 streams compared to the previous three weeks where I had 2497. This is a 12.5% increase!
Andrew Conway did a quick analysis for me and said there is a ‘statistically significant upward trend there. On average, you’re gaining 0.26±0.06 listeners per day, and the increase in streams per day is 0.43±0.09.’. Thank you Andrew for adding rigor to the numbers!
Listeners grew from 2111 to 2330. A slower but still marked 10.4%. As a side note I’d rather listners grew more slowly because it implies the people who are listening to my music are listening to more of it.
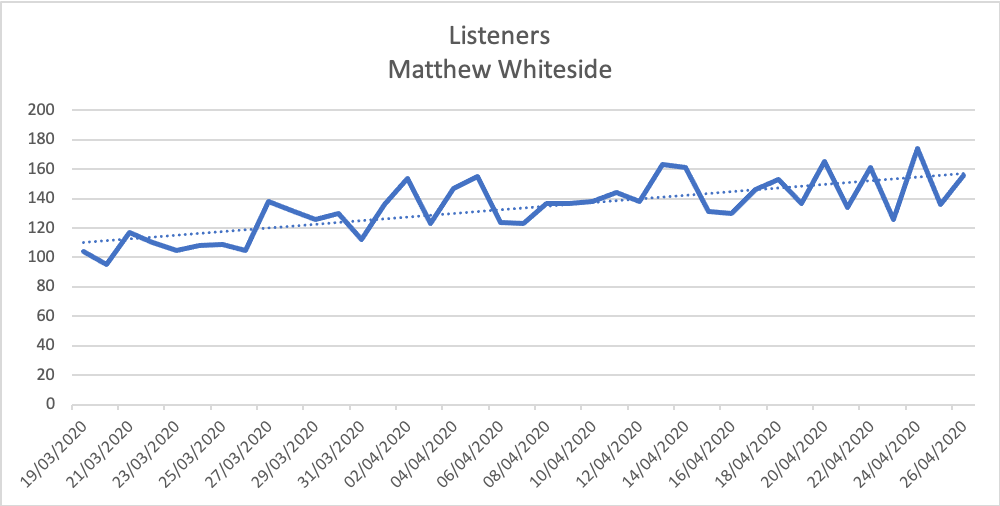
As a comparison the below shows my streams from the start of 2020. They have been slowing down a bit. I think thats largely because my promotional activity around Entangled, my recent album of three string quartets and electronics, had been slowing down with the spike around the time BBC Music Magazine published their review.

There is a similar trend on my YouTube channel score followers, with an increase of views from 2568 to 3608 which is about a 40% increase. The graph below is a screenshot from YouTube comparing the same period as Spotify.

I’ve had a look at my Apple Music for Artists and there isn’t a comparable trend. They don’t seem to allow you to download the data in the same way as Spotify so can’t do a similar analysis. But Spotify and YouTube are two of the most popular ways people listen to music so the combination is interesting enough.
I would be very interested to know if this trendy was reflected across classical music. There is a huge amount of online cultural activity happening at the moment through large scale streams like OperaVision, the Royal Opera House online, the Globe and the many comparable live streams along with smaller scale performances like RCS at Home and Live Music Now Together at Home and many many individual streaming performances. From my Twitter stream it seems there is a large amount of engagment with these long-form cultural activities.
Could this mean that given the chance, time and reduced risk (eg ticket costs) people are much more interested in trying something new? I’d hope so. I hope that this moment of (kind of) pause gives people the opportunity to discover new things (even if just new to them). This is just data from one person and I am not a data scientist so my analysis is pretty basic.
Update – 27th April
I just saw this article on Quartz which shows how the lockdown is effecting different genre. Turns out classical is one of only three showing an increase! An increase of 0.3% but still an increase. The other two are folk and children’s. Children’s makes a lot of sense given the number of parents entertaining their children at home.
With this info I took another look at my Spotify analytics and they are definitly up. Not just by a small amount but according to Spotify my 28 day stream and listener are up 28% compared to the previous period!

What is interesting about this period is I’m not doing any advertising. Around Entangled’s release I paid for some advertising but I’m not now. So this is all totally organic. I think I am going to try and do some predictions based on these trendlines and see what happens.
If you’ve got any thoughts or want to submit your own data semd me a Tweet or email me.
Also if you want to add your streaming numbers to my data then you can:
You can see the raw Spotify figures on this Google Doc and more info on me at my Biography page.
Pingback: Analytics: Listening In Lockdown – Hypebot – I.G.C Music